

Hello and thanks for opening up the NILnomics newsletter. On Friday, the College Sports Commission published its first percentile data on revenue-share and NIL pay. I used it to price every roster in an athletic department, and I built a dashboard that lets you change every assumption behind the estimates. Before I dive in, some shameless self-promotion.
Per the results of a Twitter/X poll, I’ll be diving into Colorado’s athletic department academics soon. Here was the poll:
If you’re not following me there, I suggest doing so if you want to see the next poll.
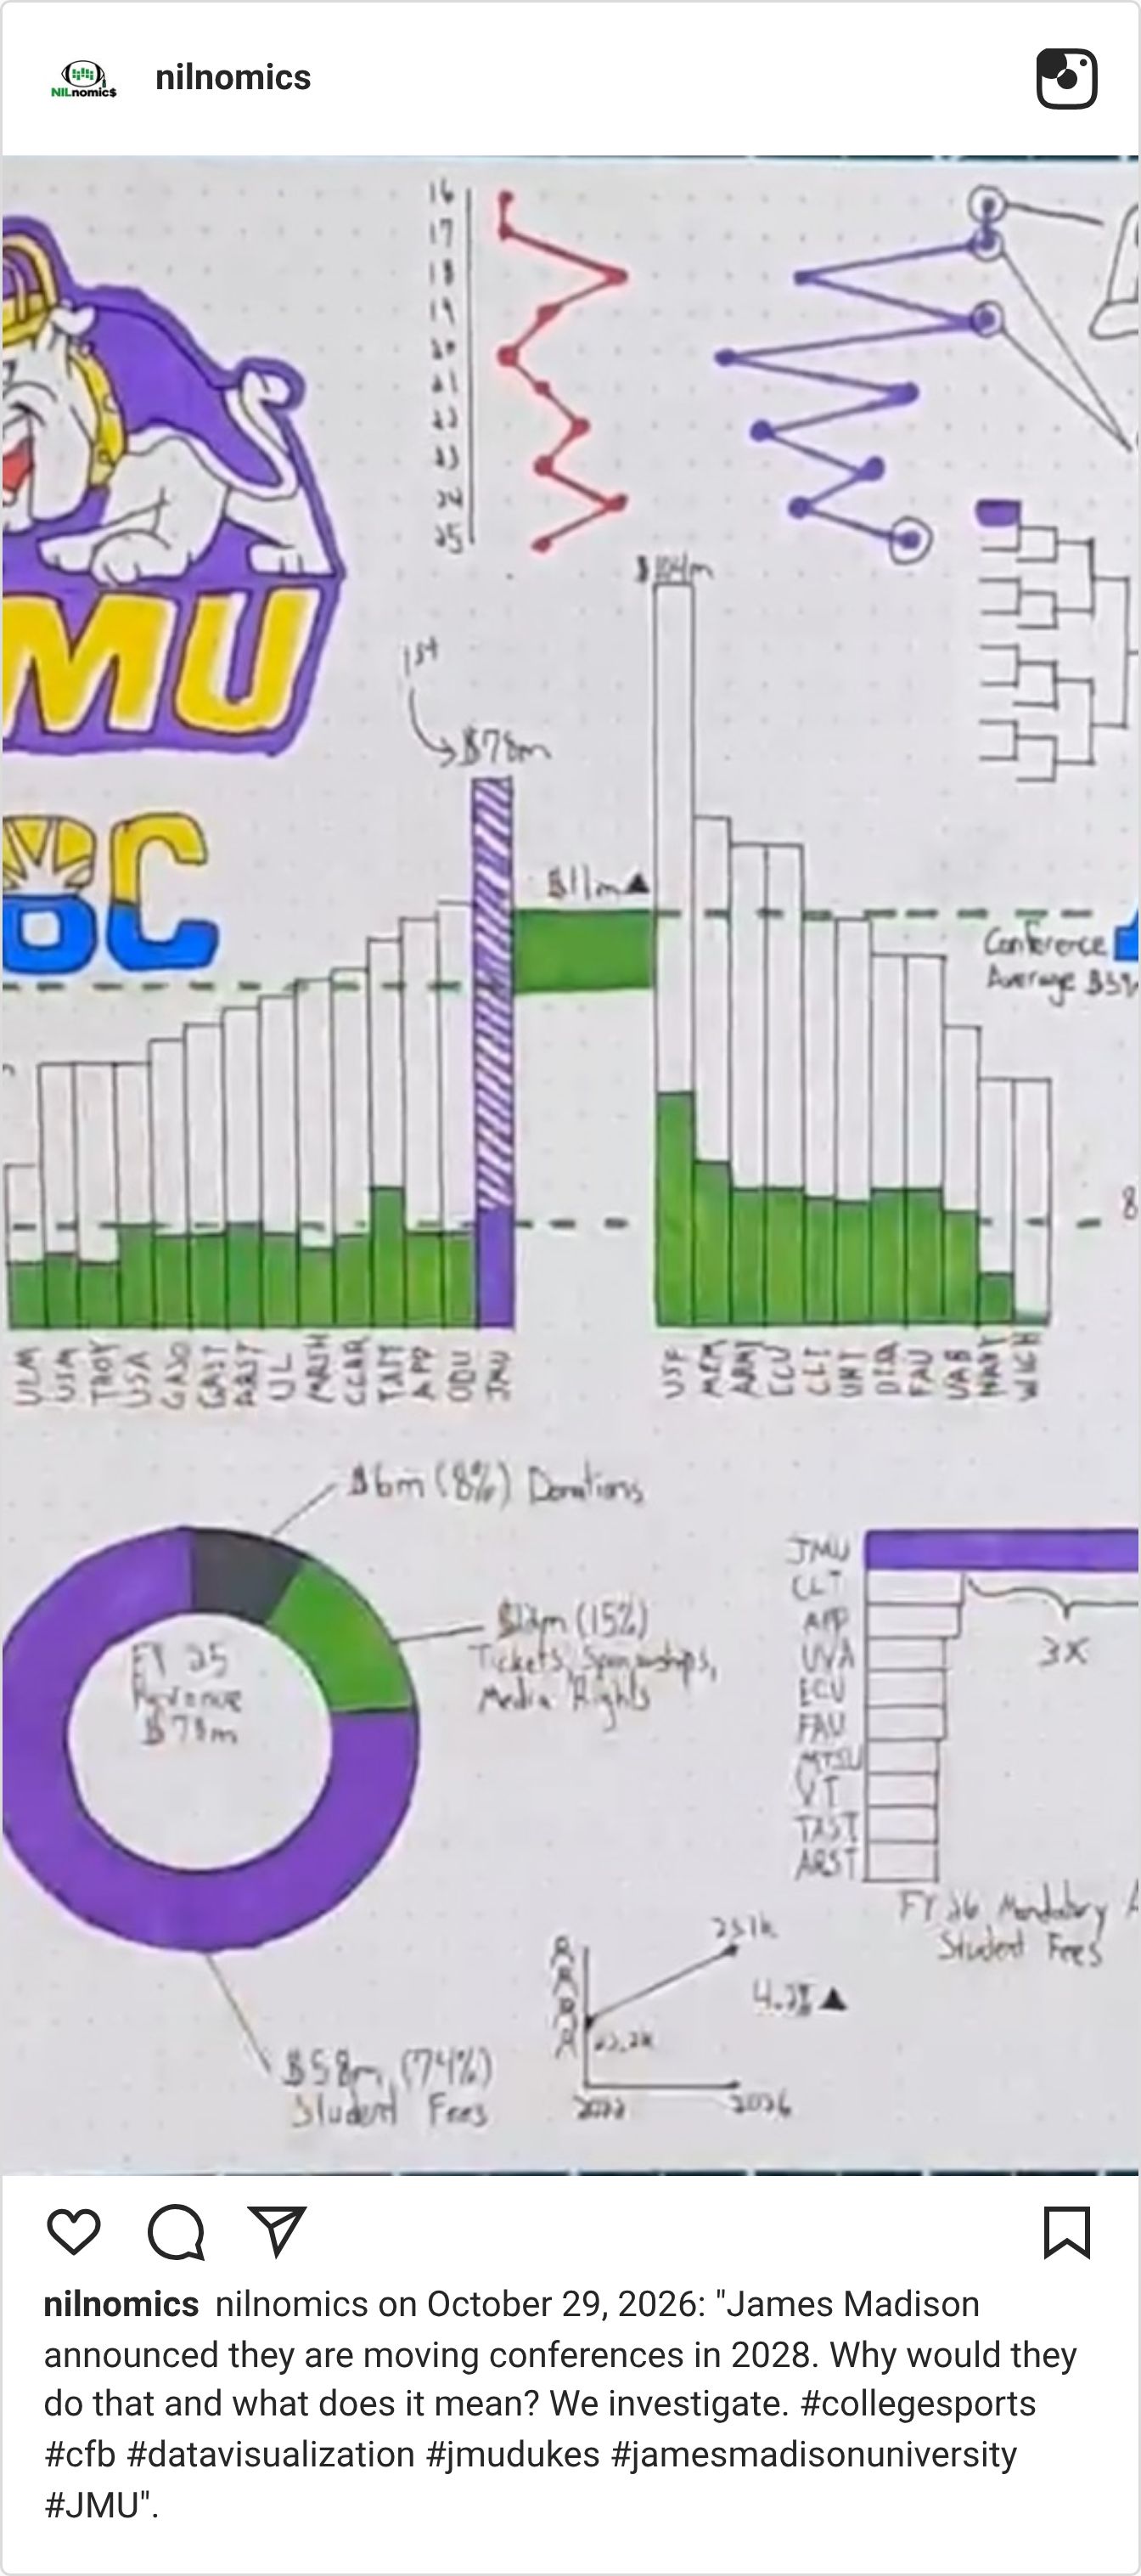
Also, if you haven’t seen already, I’ve started doing explainer videos. Short, fun drawings where I cover a topic in the news. The latest was on JMU. Check it out if you’re interested (like, subscribe, share, etc):
Onto the article.
What the College Sports Commission released
On Friday, Oct. 30, the College Sports Commission published two compensation reports that show, for the first time, how pay is distributed among college athletes rather than only how much was paid in total. The School Revenue Share Compensation Report draws on the College Athlete Payment System (CAPS), where schools record the payments they make directly to athletes under the House settlement. The NIL Go Payments Compensation Report draws on NIL Go, the clearinghouse that reviews third-party name, image and likeness deals. NILnomics has combined both reports into a single spreadsheet (which you may download for free!).
Each report lists the 90th, 75th, 50th, 25th and 10th percentiles of pay for a set of cohorts. Football is reported by position group and every other sport as a whole. Each sport is reported with data for the A4 (the ACC, Big Ten, Big 12 and SEC) and separately for every other Division I school that opted into the settlement, except men's and women's basketball are reported for each A4 conference and for all other schools. The revenue-share cohorts come in two versions. The “With $0” cohort counts every rostered athlete, paid or not, while the “Without $0” cohort counts only athletes who received or were scheduled to receive a payment. The difference between the two is the number of rostered athletes who received no revenue share. Smaller cohorts report fewer percentiles and cohorts with fewer than 10 athletes report none.
The reports followed the commission's first accounting of the revenue-sharing year. On Oct. 1, the CSC reported that schools paid $1.77 billion directly to 34,915 athletes at 307 schools in 33 conferences and 45 sports, and that 63 schools reached the $20.5 million cap while five more came within 5% of it, according to Forbes. NIL Go had cleared 46,478 third-party deals worth $582.49 million through Aug. 31, 2026, according to the commission. Those totals showed how much money moved. The new reports show where in each roster it went.
There are three pieces to be considered before the analysis begins. The reporting windows differ by sport. Football revenue share covers payments made or scheduled for 2026 rosters, including performance incentives not yet earned. Basketball revenue share covers payments to 2025-26 rosters made through April 6, 2026. Lastly, every other sport covers the 2025-26 cap year, which ended June 30, 2026. NIL figures are the full contract value of deals cleared in each window, are not annualized, and exclude athletes with no cleared deal. Neither report includes scholarships, cost-of-attendance stipends, or Alston awards.